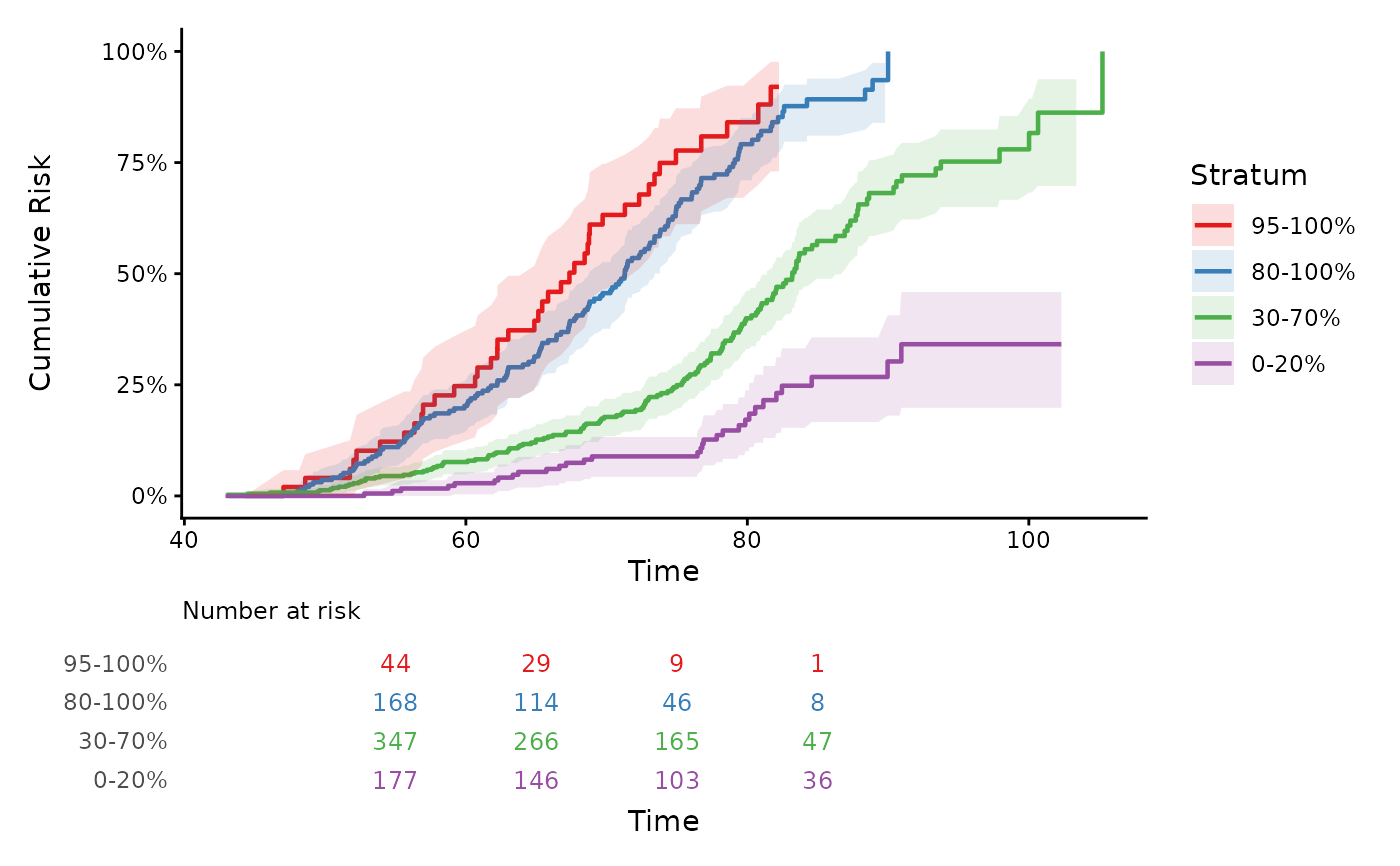
Combines a phs_abs_risk() or phs_km_curve() plot with a numbers-at-risk
strip using patchwork. Accepts either an already-built risk table ggplot
(from phs_risk_table()) or a raw data.frame, in which case
phs_risk_table() is called internally with any extra arguments passed via
....
Usage
attach_risk_table(plot, risk_table, heights = c(3, 1), ...)Arguments
- plot
ggplot object returned by
phs_abs_risk()orphs_km_curve(), optionally with additional layers applied.- risk_table
ggplot object returned by
phs_risk_table(), or a data.frame. When a data.frame is supplied,phs_risk_table()is called internally; any additional arguments (e.g.intervals,time_points,palette) are forwarded via....- heights
numeric vector of length 2 controlling the relative heights of the curve and table panels (default
c(3, 1)).- ...
additional arguments forwarded to
phs_risk_table()whenrisk_tableis a data.frame. Ignored whenrisk_tableis already a ggplot.
Examples
if (requireNamespace("patchwork", quietly = TRUE)) {
  data(test_data)

  # Quick usage: build and attach in two lines
  p <- phs_abs_risk(test_data)
  attach_risk_table(p, test_data)

  # Full control: customise both objects before combining
  p  <- phs_abs_risk(test_data) + ggplot2::theme_classic()
  rt <- phs_risk_table(test_data, time_points = c(55, 65, 75, 85))
  attach_risk_table(p, rt)
}
#> Warning: Removed 2 rows containing missing values or values outside the scale range
#> (`geom_ribbon()`).